What Is A Balance Sheet And How To Understand It?
Contents
Share
When running your business, it’s critical to interpret the numbers on your financial statements to make informed business decisions.
This blog will go through the balance sheet from top to bottom. We go through each section and how you can use the information on your balance sheet to understand how your business is performing.
What is a balance sheet?
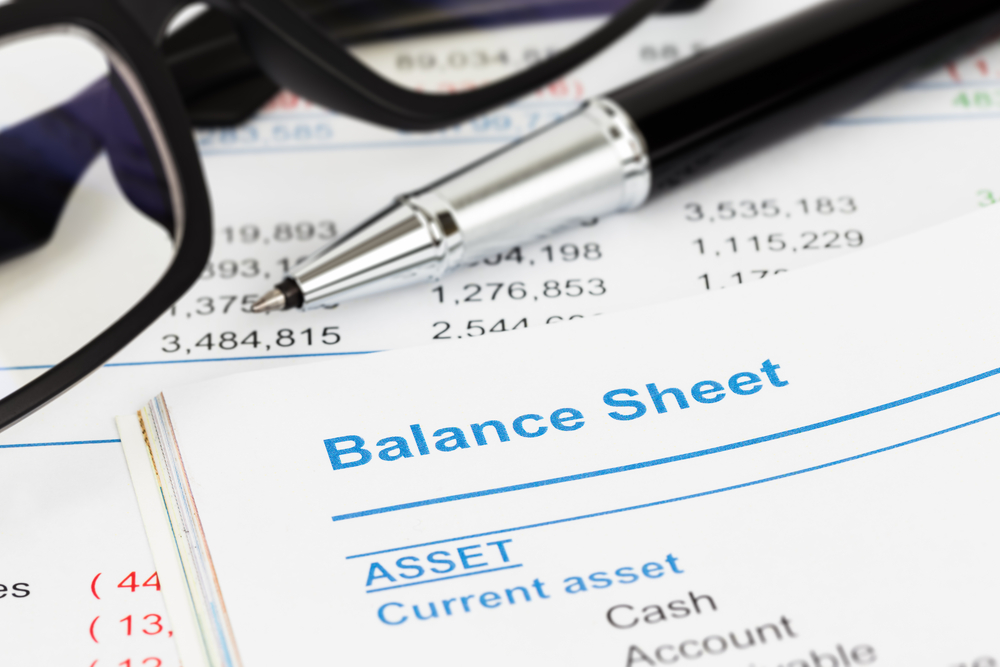
A balance sheet, also called a statement of financial position, is a financial statement that shows the assets, liabilities, and equity of a business at a point in time.
The balance sheet, income statement, and cash flow statement comprise a company’s primary financial statement documents. Although we are focusing on the balance sheet today, it’s best to look at all three financial statements together to get a complete view of your business’s health.
The accounting equation
The balance sheet shows what your company owns (assets) and what your company owes (liabilities and shareholders’ equity). The value of the assets must always equal the value of the funds, either borrowed or earned through profit.
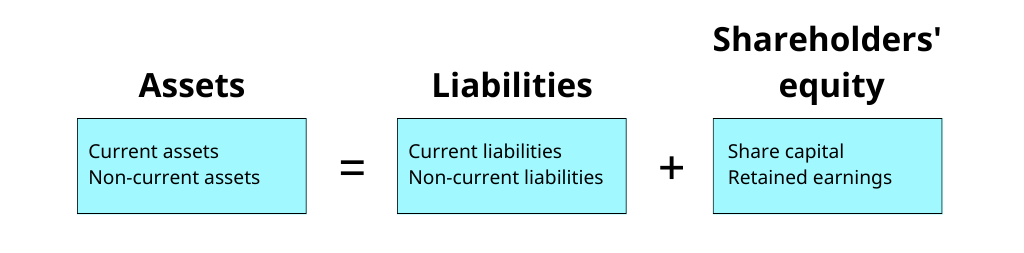
Let’s take a look at an example.
A business buys a new forklift for $25,000 and finances it over five years.
The cost of the forklift gets added to non-current assets under property plant and equipment, which increases assets by $25,000.
The loan for $25,000 gets added to current liabilities for the portion of the loan that will be paid within the next 12 months, and the remaining portion of the loan is recorded as long-term debt under non-current liabilities.
The loan for $25,000 gets added to current liabilities for the portion of the loan that will be paid within the next 12 months, and the remaining portion of the loan is recorded as long-term debt under non-current liabilities. The total of the current portion of long-term debt and long-term debt will equal $25,000.
So, we see that the balance sheet has balanced by increasing both sides of the equation, assets increase by $25,000, and liabilities increase by $25,000.
Sample balance sheet
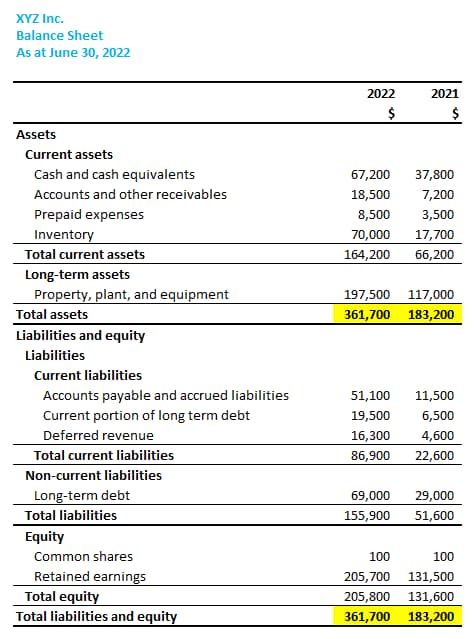
The following example shows how a balance sheet is laid out. Your accounts may be named differently, or you may have different accounts than those shown, depending on your company’s assets and liabilities. The highlighted sections show that the assets equal the liabilities plus the shareholders’ equity.
What are the components of a balance sheet?
As we have seen above, the balance sheet comprises three sections, assets, liabilities, and shareholders’ equity.
Assets
Current assets
Current assets are any assets that are expected to be turned into cash within the next 12 months. These include:
- Cash
- Short-term investments – investments that can be sold quickly and are only intended to be invested for a short period. Typically, they are less risky due to their shorter time frame.
- Prepaid expenses – these are expenses that have been paid in advance of the expense actually being used, such as rent or insurance.
- Accounts receivable – cash that is still owed to the company from customers.
- Refundable taxes – corporate tax refund or GST refund.
- Inventory – goods that are available for sale to customers.
Non-current assets
Non-current assets will not be turned into cash within the next 12 months. These include:
- Long-term investments – investments that are typically riskier than short-term investments, may be less liquid, and are held on for longer periods to realize gains.
- Property, plant and equipment – larger assets that are actively used for several years in the business, such as vehicles, computers, and furniture.
- Intangible assets – goodwill, intellectual property, and trademarks.
Liabilities
Current liabilities
These are all the liabilities that will come due within the next 12 months. These include:
- Accounts payable – invoices from vendors that have been received but not yet paid.
- Wages payable – wages that have been earned by employees but haven’t been paid to them yet.
- Vacation payable – employee vacation pay that hasn’t been paid out to them yet.
- Taxes payable – corporate taxes owing, GST owing, PST owing, source deductions.
- Accrued liabilities – expenses that need to be paid but your business hasn’t received an invoice for them yet.
- Deferred revenue – payments that have been received from customers for products or services that will be delivered in the future.
- Current portion of long-term debt – the portion of a loan or mortgage that your company will pay over the next 12 months.
Non-current liabilities
These are liabilities that will still be outstanding after 12 months.
- Long-term loans, mortgages, and leases will be recorded under this section.
- Deferred revenue may also be recorded as a non-current liability if you don’t expect the work to be performed in the next 12 months.
Equity
The equity section includes the following:
- Share capital – Share capital is the amount shareholders pay for their shares when a company is first incorporated. As the business is not worth anything when it’s first incorporated, the shareholder can pay a nominal amount for each share they purchase.
- Retained earnings – Retained earnings are the accumulated profit or loss of a business since it was incorporated.
What information can you get from a balance sheet?
Several ratios can be calculated from numbers on the balance sheet. These ratios can give you a better idea of the health of your company.
It’s important to understand that ratios vary from industry to industry and that a ratio that may cause concern in one industry may be considered a health ratio in another industry.
Current ratio
The current ratio measures your company’s ability to pay short-term obligations when they come due.
The current ratio formula is:
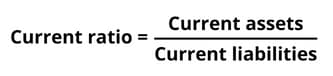
Using the balance sheet example above, we can calculate the current ratio for XYZ Inc.
Current assets for 2022 are $164,200, and current liabilities for 2022 are $86,900. The result is a current ratio of 1.89 for XYZ Inc.
Your current ratio should be greater than 1. Anything below 1 indicates that your company is not able to pay its short-term obligations. If you are applying for financing with a bank, they may want to see a current ratio of 2 or more.
Quick ratio
The quick ratio, also known as the acid test, is similar to the current ratio but subtracts inventory and prepaid expenses from current assets. This more conservative ratio includes only assets that can be turned into cash within 90 days.

To calculate the quick ratio for our balance sheet example, we take the total current assets of $164,200 and subtract inventory of $70,000 and prepaid expenses of $8,500 to give us $85,700. We then divide $85,700 by current liabilities of $86,900 to provide a quick ratio of 0.99.
This is right on the boundary of the preferred minimum ratio of 1. We can now see that there is more uncertainty as to whether XYZ Inc. will be able to pay its current liabilities over the next few months.
Working capital
Working capital is the cash left over after subtracting current liabilities from current assets.
The greater the amount of working capital, the better position the company is to pay its vendors as well as deal with any issues that arise in the future.

From our balance sheet example, our working capital for XYZ Inc. would be $164,200 – $86,900 = $77,300.
Debt-to-equity ratio
The debt-to-equity ratio indicates how much leverage your company has. If the ratio is less than 1, your company’s capital structure is more focused on equity financing. If it’s greater than 1, it’s focused more on debt financing.
Banks use this ratio to determine your company’s ability to cover debt obligations.
Debt-to-equity ratios differ based on the industry your business operates. A high debt-to-equity ratio may indicate that a company is too risky. However, it may be considered an acceptable investment if a business has the cash flow to cover debt obligations.

Using the information from XYZ Inc.’s balance sheet, their debt-to-equity ratio is calculated as follows:
Total liabilities are $155,900, and total equity is $205,800, which gives us a debt-to-equity ratio of 0.76.
This indicates that the company is not highly leveraged with debt and instead uses equity as its primary source of financing.
Lifetime capital gains exemption (LCGE)
Although not a ratio, as a shareholder of a Canadian Controlled Private Corporation (CCPC) it’s important to monitor your eligibility for the LCGE as it could save you hundreds of thousands of dollars in tax if you ever sell your shares.
For 2022, the LCGE is $913,630 if you meet the eligibility requirements.
Assets that are not actively used in your business can prohibit you from utilizing the LCGE, so it’s important to monitor any changes on your balance sheet to determine if changes need to be made to ensure you qualify for the LCGE in the future.
Visit our corporate accounting services and plans pages to learn more about how we can assist you in reaching your goals. They provide an overview of our services, including information on the benefits and features of each. Feel free to contact us if you have any questions about our services.